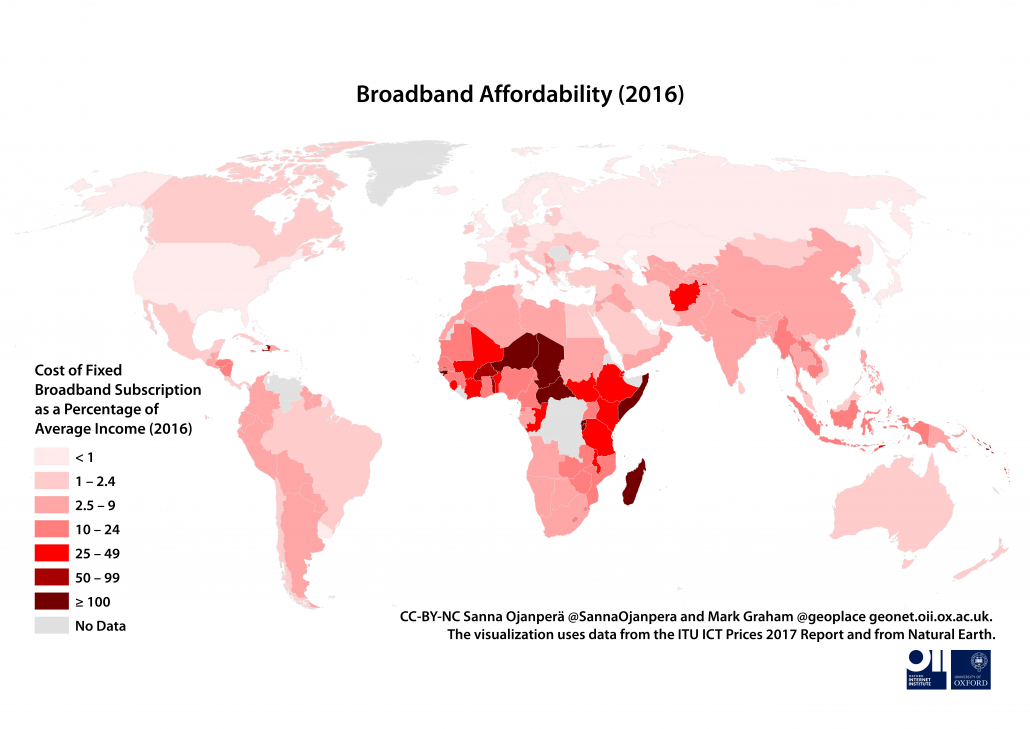
The relative cost of being connected to the internet underpins the global digital divide. This visualization illustrates the unevenness of the geographies of broadband affordability, the ramifications of which can be seen in some of the other visualizations created by our project, such as the cartogram of the world online and the archipelago of disconnection.
While the absolute cost of broadband connection has been dropping in Africa, the prices are still out of reach for many people earning average incomes in various parts of the continent in 2016. Comparison to a similar map our research team produced a few years ago using data from 2011 shows that broadband affordability has improved for some countries on the continent, but the most unaffordable prices are now even more concentrated in African countries.
A monthly broadband subscription costs around 50 USD in Niger and Ireland. However, while the Irish internet user earns an average yearly gross income of 53,000 USD, the Nigerien will make 390 USD. So, whereas the Irish would spend just over half of her weekly salary to cover the subscription for an entire year, the Nigerien would need to allocate over one and a half year’s earnings to do the same.
Central African Republic is the country where broadband internet is least affordable. A yearly subscription there amounts to 18 years’ worth of an average salary! 9 countries still face broadband subscription costs higher than the average income, including 8 Sub-Saharan African countries and the Solomon Islands.
Vietnam, Syria and Ukraine have the cheapest prices and broadband connection can be obtained for around dollar or two per month in these countries. Europe and North America have the lowest relative costs where less than a percentage of average income will buy an annual broadband subscription.
The data mapped here are some of the world’s most salient indicators of digital connectivity. Where the ability and means to connect remain out of reach, the opportunities and information afforded and mediated by the internet are unattainable.
Data
The map uses the “Fixed-broadband sub-basket as a percentage of GNI per capita” indicator published by the International Telecommunication Union (ITU) in the ICT Prices 2017 report. We map the 2016 data, being the most recent information available for this indicator in the report.
The ITU defines the indicator as the following: “the monthly price for an entry-level fixed-broadband plan with a minimum monthly data allowance of 1 GB and for a minimum advertised download speed of 256 kilobits per second (kbit/s)”.
These values have been multiplied by twelve to obtain a yearly cost, and weighted over the gross national income per capita (Atlas method, current USD) data available from the World Bank, referring to the previous year (2015) and adjusted for inflation in order to show them relative to the size of the economy of each country, thus pointing to the affordability at the country level.
