The previous post in this mini-series, Who can access the internet?, looked at internet penetration in country context. In this post, we compare world regions and their access to the internet.
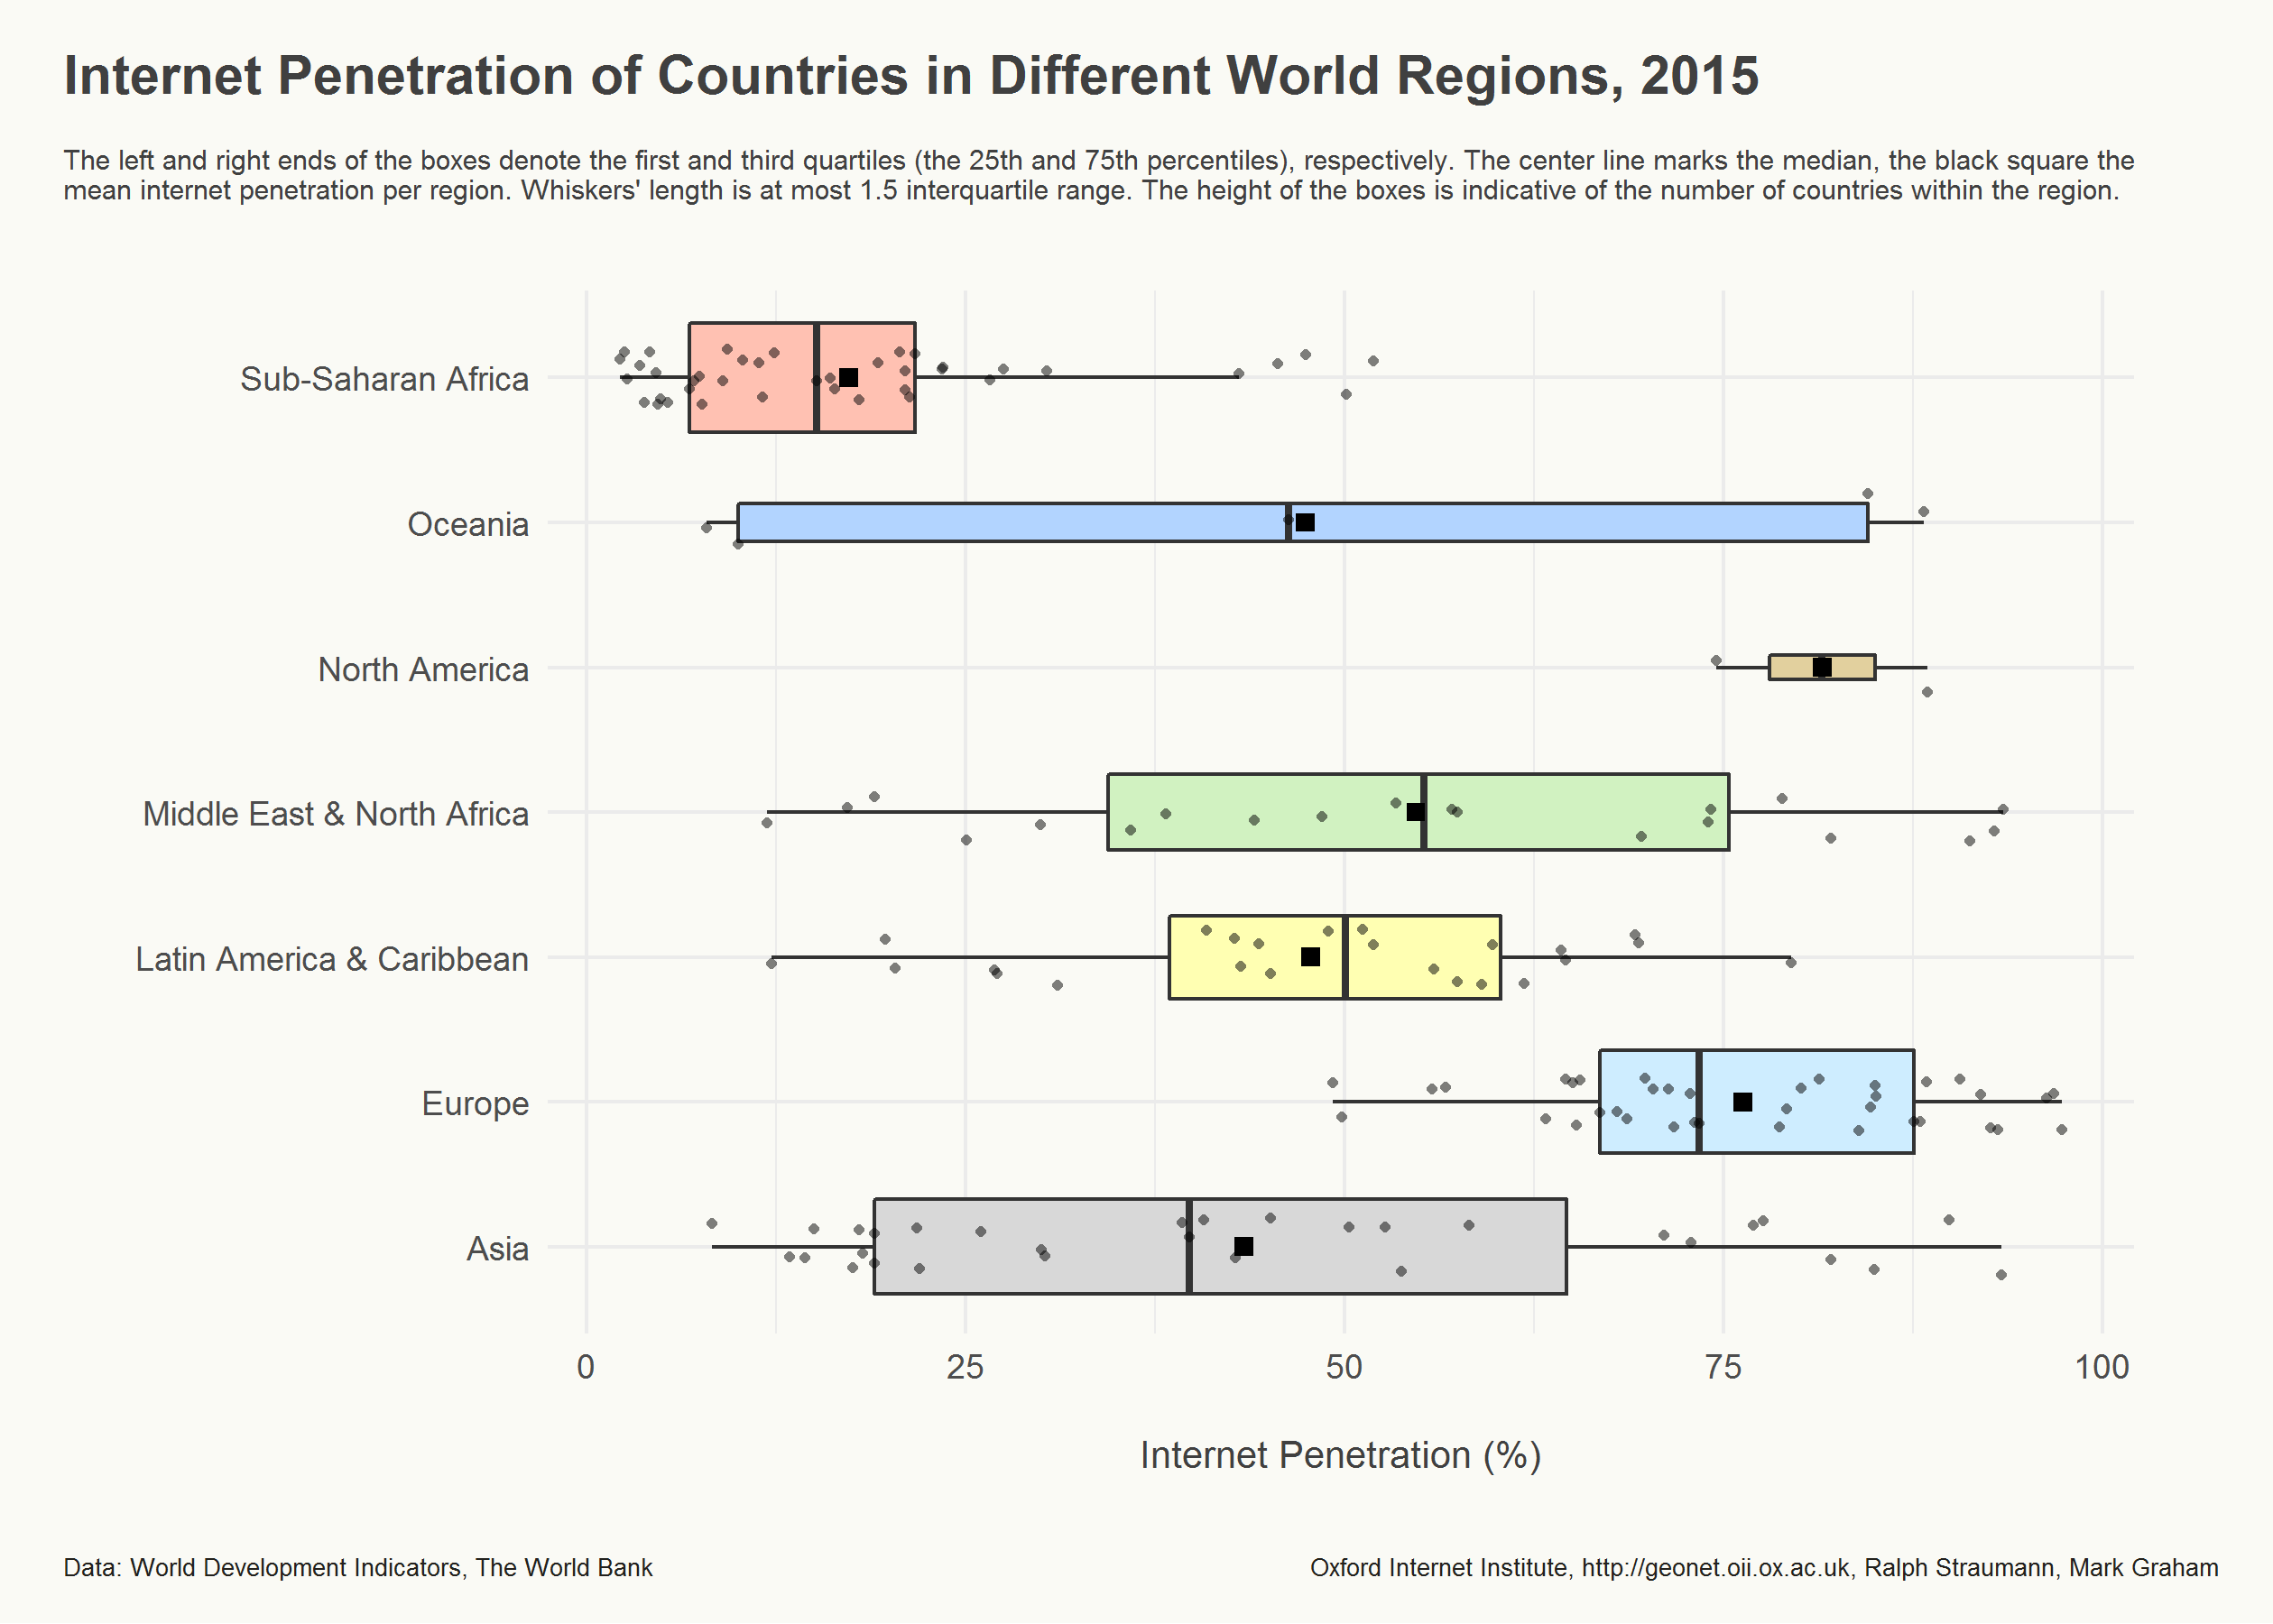
This box plot visualization shows the distribution of per-country internet penetration, i.e. the percentage of the population of countries that has accessed the internet within a 12 month period from any device, for all seven world regions (click for full size). Each small dot denotes a country. The small black squares represent the average regional internet penetration, the thick vertical lines the median regional internet penetration. Finally, the height of the colored boxes correlates with the number of countries within the region at hand – North America and Oceania being the smallest regions in terms of number of countries.
Bear in mind: average global internet penetration in 2015 was at 47% with a standard deviation of 29%.
First, the above visualization underlines the findings from the Access to the Internet map: internet penetration is clearly lowest in Sub-Saharan Africa (SSA; mean: 17.3%, standard deviation: 13.8%) with only few countries reaching average global values near 50% (e.g. Nigeria, Kenya, South Africa).
Second, internet penetration is highest, and clearly above the global average, in the world’s economic cores: Europe (mean: 76.3%, standard deviation 13.2%) and North America (mean: 81.5%, standard deviation 9.8%).
Third, with a mean of 47.8% (standard deviation of 17.7%), Latin America & Caribbean (LACA) is very close to the average global access to the internet.
Fifth, this visualisation reveals clearly (more clearly than our previous map) that internet penetration varies wildly among the countries of Asia (mean: 43.4%, standard deviation: 26.3%), Middle East & North Africa (MENA; mean: 54.7%, standard deviation: 26.5%), and, especially, Oceania (mean: 47.4%, standard deviation: 38.8%). Individual Asian and MENA countries reach high European levels of access to the internet.
The below visualization of highest (left) and lowest (right) internet penetration also looks at 2005 and 2010 (in addition to 2015) and thereby highlights how stable over time some of these patterns of internet access truly are: Individual countries move up and down the ladder between years (and they certainly move in terms of absolute values of internet penetration). Yet, the regional patterns embodied in the rankings of the countries hardly change at all. Thus, on a relative scale, the cores and peripheries of the global network are surprisingly stable indeed.
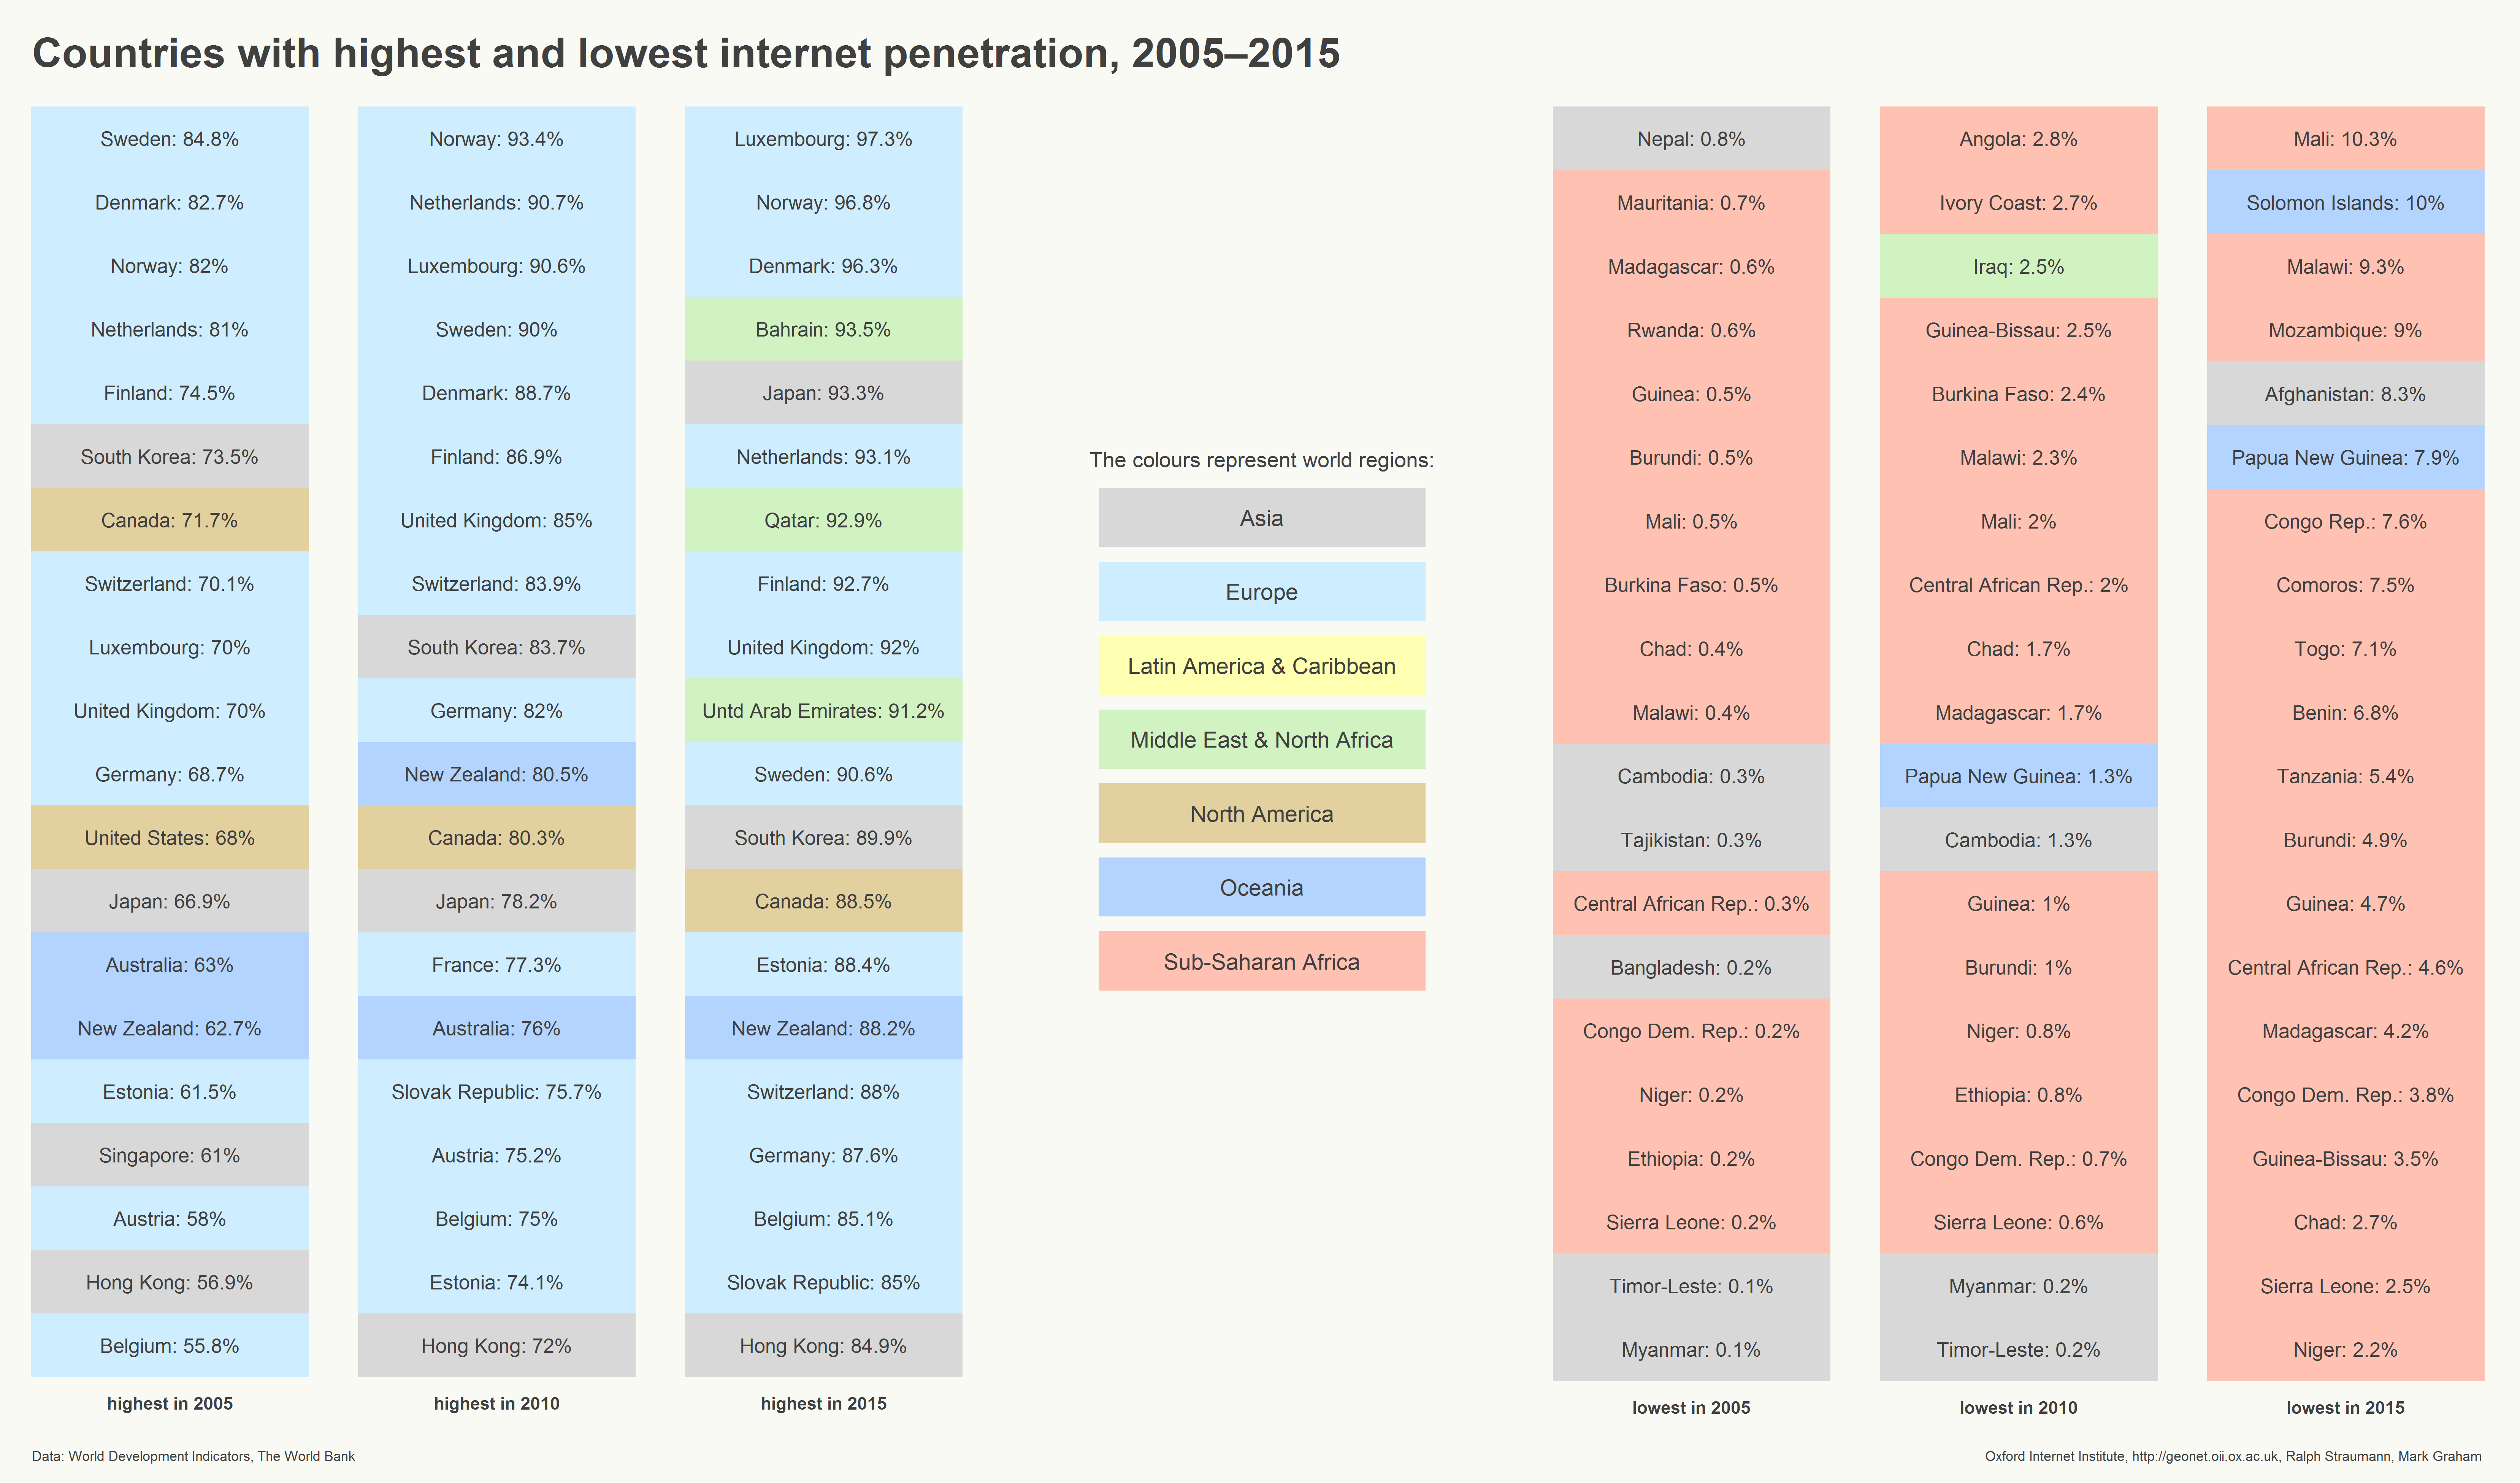
This leader board visualization shows the the countries with the highest (left) and the lowest (right) internet penetration, in 2005, 2010, and 2015, respectively (left to right). The colors encode the countries’ region affiliations.
Series
This blog post is part of a mini-series:
- Who can access the internet?
- World regions’ access to the internet
Data
The visualizations use data on internet usage in 2005, 2010, and 2015 that was obtained from the World Bank. The World Bank has tracked the number of internet users per country since the 1990s as part of its Worldwide Development Indicators project.