Findings
This visualization speaks to one of the core themes of the global digital divide: the relative cost of being connected to the Internet. The geographies of the phenomenon could hardly be more clear, and its consequences are illustrated in many other visualizations published on our website, from the cartogram of the Internet population to the graphic depicting the geographic distribution of the top-level domain names.
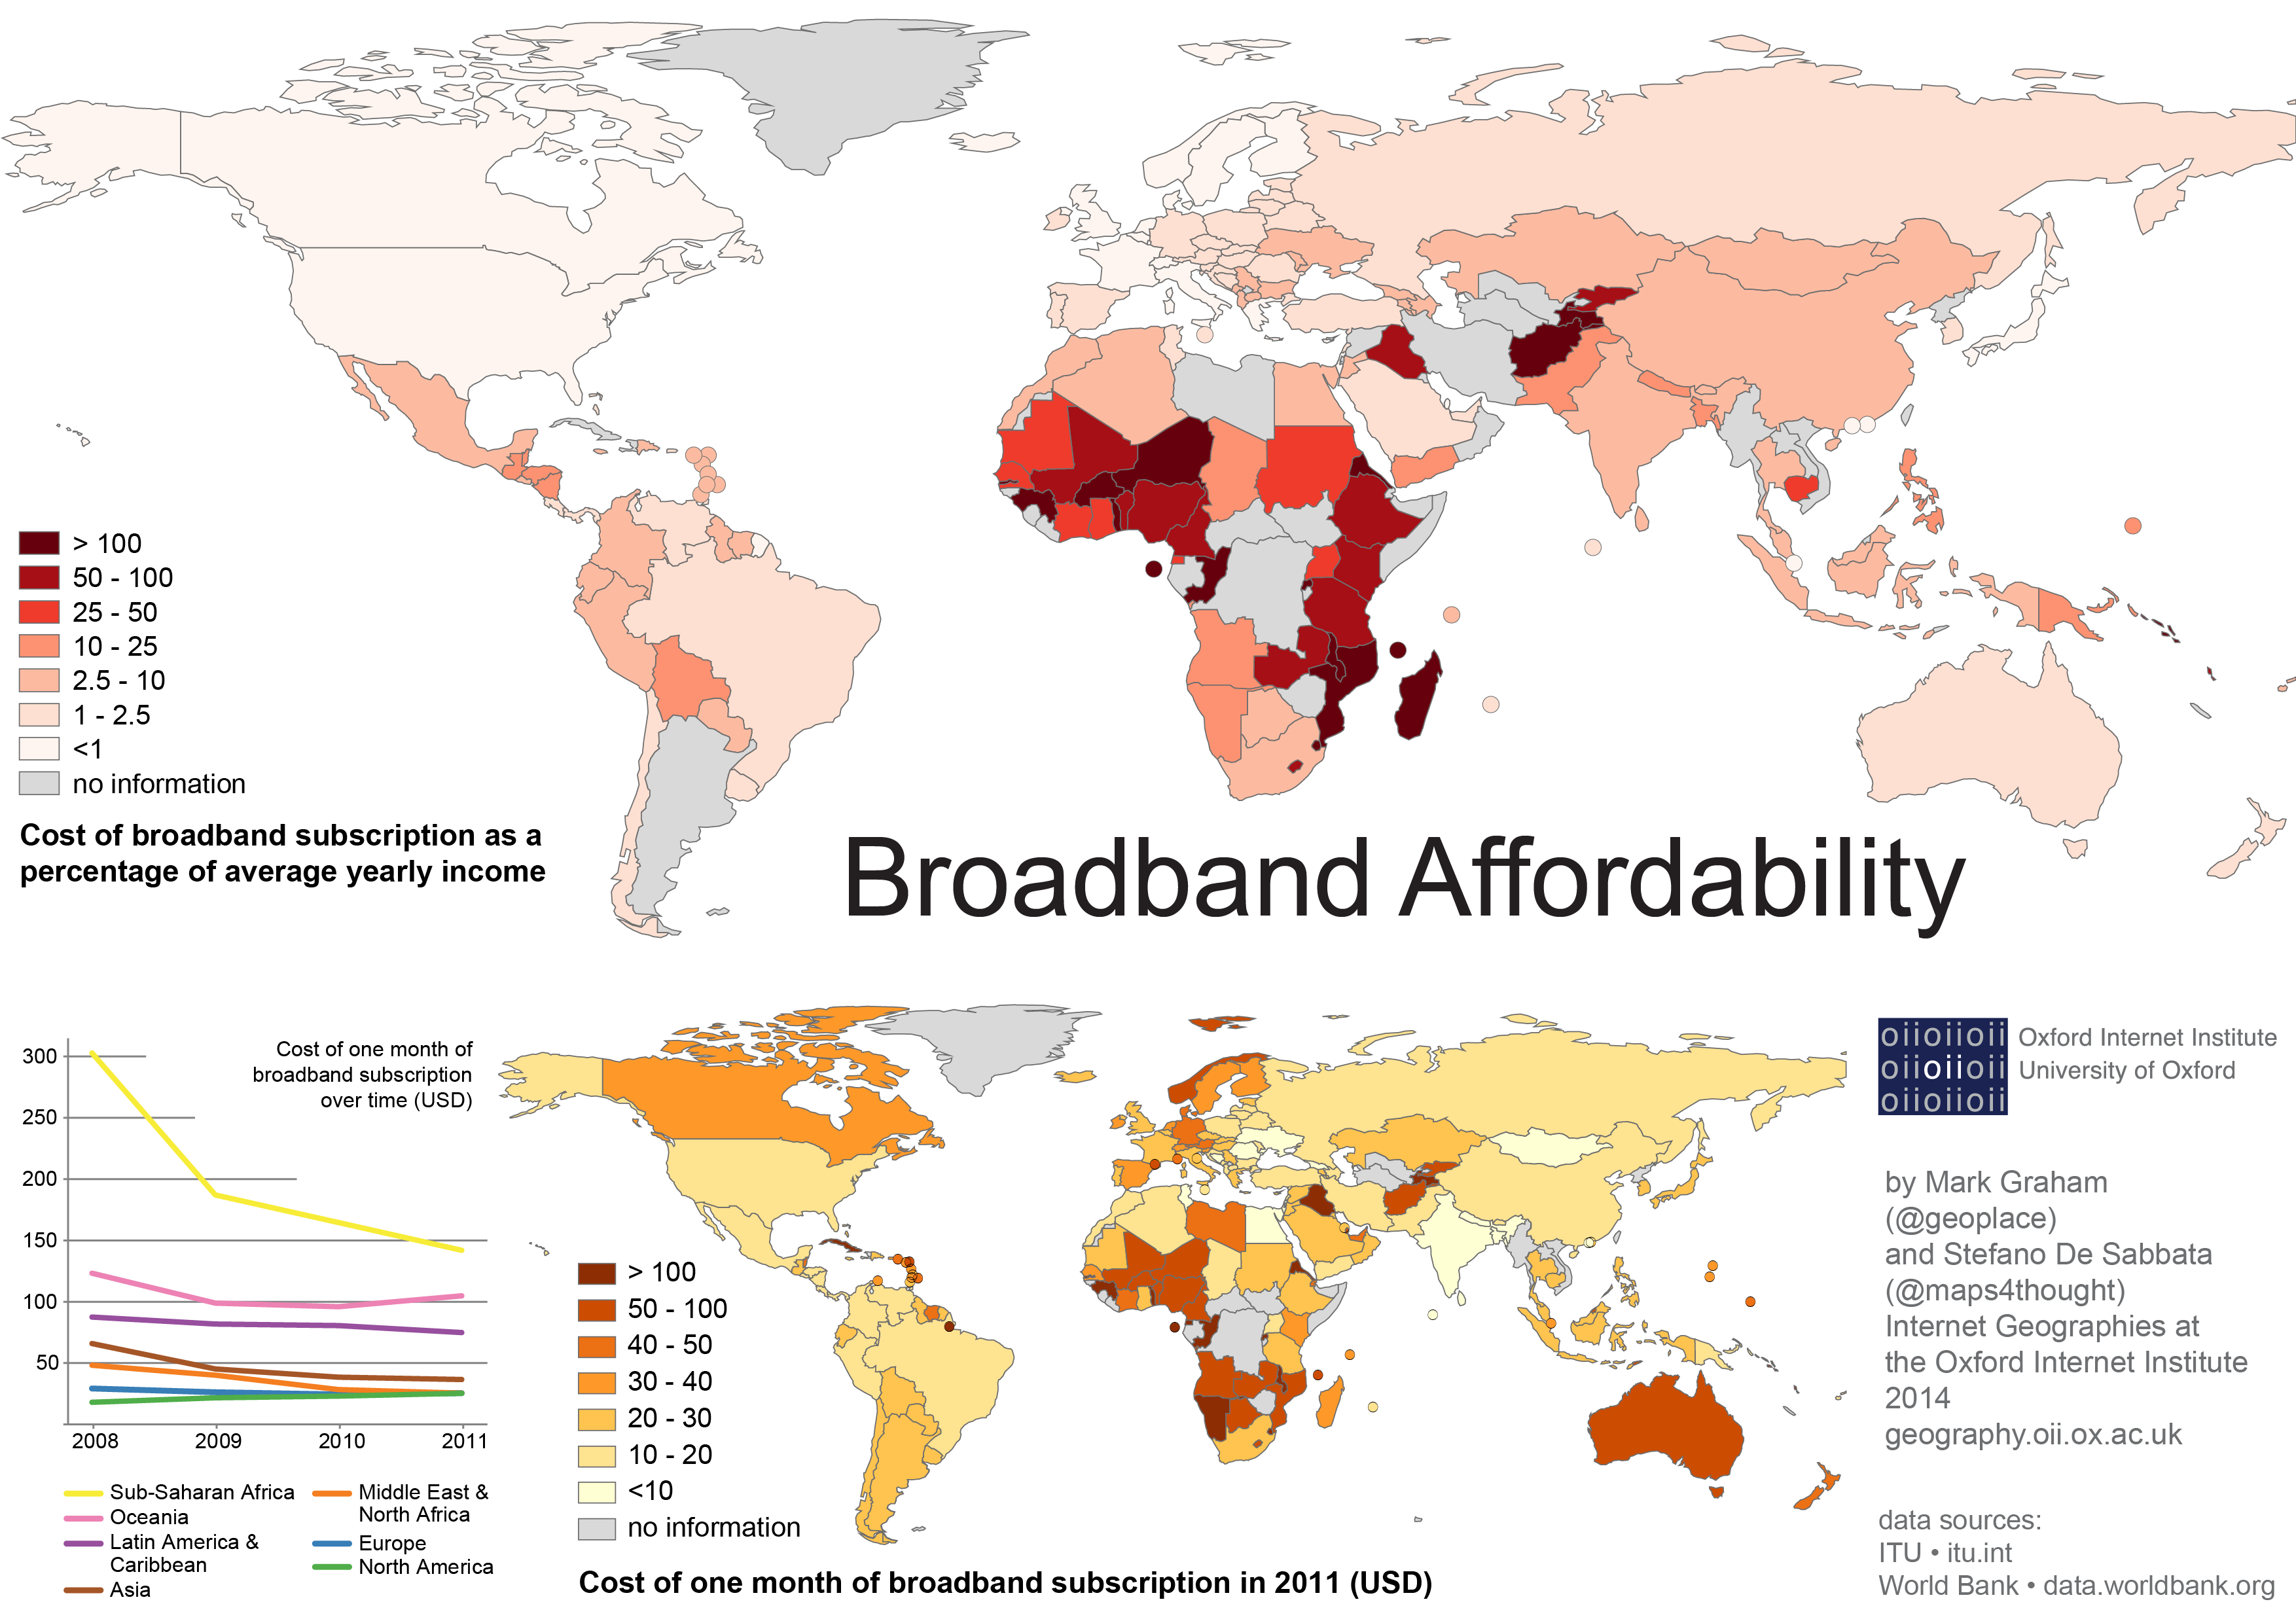
We see that the price of a broadband connection in most parts of Africa is out of reach for people on average incomes. Said differently, Africans need to pay ten times as much of their salary (if looking at the ratio of income to connectivity costs) for broadband as people in the rest of the world.
A monthly broadband subscription costs about 60 USD both in Australia and Mozambique. However, while the average yearly gross income in Australia is around 50,000 USD, the same figure in Mozambique is less than 500 USD. This means that while an average worker in Australia could pay for a year’s worth of connectivity with one week’s salary, a Mozambican worker would need over one and a half year’s salary.
This situation does not mean that costs in Africa aren’t dropping. The average cost of an African Internet connection is now half of what it was four years ago, thanks to a series of cables laid around the African continent in 2009. Kenya and Nigeria, for instance, have 2011 broadband costs that are respectively 21% and 8% of what they were in 2008. These changes have undoubtedly contributed to the significant growth in the number of Internet users seen by both countries. The most striking drop in broadband cost has been observed in Burkina Faso, which has gone from over 1,700 USD a month to a most reasonable 55 USD (which still, however, represents 100% of the salary of an average worker).
Eritrea is the country where the Internet is least affordable. A yearly subscription there is the equivalent of almost fifty year’s worth of an average salary: an entire life of work! Over 18 countries still face costs of Internet subscriptions higher than the average income, including 14 Sub-Saharan African countries, the landlocked countries of Afghanistan and Tajikistan, and the islands of Kiribati and Solomon Islands. A broadband Internet connection cost over 500 USD a month in the Central African Republic, Guinea, Malawi, and Swaziland, as well as in Cuba, where, according to the ITU, 1,700 USD was still not enough to buy a subscription.
India and Sri Lanka have the cheapest broadband access prices, where access can be obtained for as little as 6 USD a month. Europe and North America have higher absolute costs, ranging between about 10 and 40 USD a month, but have some of the lowest relative costs in the world: with a couple of hours of work a month being sufficient for an average worker to afford the cost of connectivity.
The data mapped here are some of the world’s most important indicators. Without the ability and means to connect, the opportunities, the information, and the communication mediated and afforded by the Internet all remain impossible.
Data
The maps use the “Fixed (wired)-broadband monthly subscription charge, in USD” indicator published by the International Telecommunication Union (ITU) in the 17th edition of the World Telecommunication/ICT Indicators Database. We map 2011 data, being the most recent information available for this indicator in the dataset.
The ITU defines the indicator as the following: “Fixed (wired)-broadband monthly subscription charge refers to the monthly subscription charge for fixed (wired)-broadband Internet service. Fixed (wired) broadband is considered to be any dedicated connection to the Internet at downstream speeds equal to, or greater than, 256 kbit/s. If several offers are available, preference should be given to the 256 kbit/s connection.”
The data also refer to the monthly cost of the cheapest entry-level subscription in any place. These values have been multiplied by twelve to obtain a yearly cost, and weighted over the gross national income per capita (Atlas method, current USD) data available from the World Bank, referring to the same year (2011).
The graph on the lower-left corner illustrates the evolution of the cost of broadband over time.